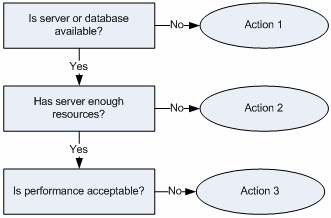
The databases and servers monitoring is a one of the most important responsibilities of the database or system administrator. It allows to minimize downtime and increase system availability.
There are three important questions for monitoring process:

- Does the server system, DBMS or production database available? In this question, we should distinguish server and database availability.
- Has the server operating system or database system enough resources to serve all customers in according to SLA?
- Is the server or database response time and performance acceptable for the company?
In most cases, these questions are nested. I.e. we can't check the performance of the unavailable database.
Event Object
Let's call "event" any question that we can ask for database status with correct and incorrect response definition. We should define a few events to describe current server or database status. For the system and database availability, we can run easy SQL query like "select 1" from system and production database. If the database available we'll get a response for both requests.
To analyze available resources we should operate with performance counters (Windows operating systems only). The most useful metrics are available RAM or CPU/cores loading.
To check server operating system availability and physical channel intactness we can try to access some folder or file like LOG at the server side of the information system.
The complex query execution against a database with response time analyzing is a good way to understand current server and production database performance.
Typical Event Definition
DTM DB Event tool is a monitoring utility that designed for continuous databases and database servers check-up. It allows users to define a few events. There are most important event properties:

- Database connection. The tool can monitor any number of servers or databases, one per event. Of course a few events can check-ups the same server or database.
- Check definition. What the tool should execute to understand database status: run SQL script, check for file availability or get Performance Counter.
- Intervals. How often the monitoring tool has to run defined check.
- Condition. There is a condition for action execution.
- Actions. The action is optional activity definition that will be performed for the event if necessary.
Conditions and Actions
There are sample conditions for "action" execution:
- Time of query execution greater that 200 ms.
- The connection or SQL statement execution failed.
- A number of rows in the result set less 10.
Currently, the monitoring tool can execute three kinds of actions: run SQL script against same or another database, call external program or command file or write a message to the log file. Also, the user can specify special conditions for some actions. For example, "stop monitoring" or "stop event".
In closing we provide a few events with actions for most popular cases:
| Event | Action |
|---|---|
| Check for server directory C:\windows existing | Send message to administrator if not available |
| Run "select getdate()" query against production database | Write to log if response time greater 100 ms |
| Get "\Memory\Available KBytes" performance counter value for server side | Run "restart.cmd" script for DBMS if value less 10,240. |