There is the third article of the series about the new generation of our database reporting software. The first one describes most important additions of the new software generation. The second dwells with title, header, and footer customization.
In most cases, we need a way to accent the attention of the report's user to some items. It is "total" column of the table, unusual or unexpected values or even whole rows, etc.
The "column property" feature is easy to use way to assign custom design to some columns of the report. The standard edition of the reporting tool allows users to define one property only. The professional edition has no limitations. Of course, this feature is not suitable for design-less formats: plain text and XML.
To assign custom design to some column the user should make three easy steps:
- Select the column.
- Specify the list of design items: size, colors, etc.
- Add it to the list of the properties.
At the moment the tool does not allow to assign more than one property to the same column. However, the user enabled to assign a few design items at once.
This example shows how to assign a bold font to column "Total":
When the column property operates with the whole column, the marker deals with a single cell or row of the report's table. The marker is a condition based way to modify a design of the report item. The marker is not applicable to plain text and XML output formats.
To create a marker the user should:
- Select a column for marker*
- Select a column for condition checking. It can be different with a column of the marker.
- Select the operation: >, <, =, !=, >=, <=, contains, starts with or in range
- Specify the list of design items: size, colors, etc.
- Add it to list of markers
* - by default the marker will be applied to the single cell if the condition is true. However, the program can mark the whole row by selected format if the condition is true. The user can switch this option on using "apply to whole row" check box.
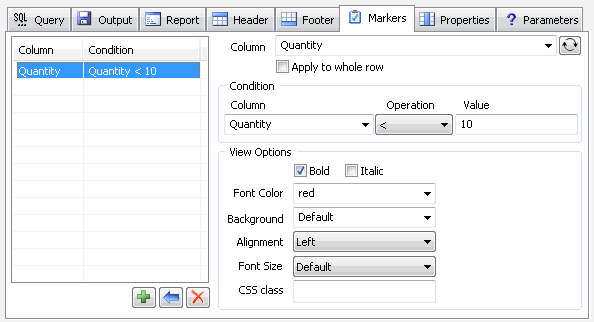
This example marks values less 10 by red bold font. To do that we:
- Select column for marking.
- Select the same column for condition.
- Select less as a condition and 0 as a comparison value.
- Assign red for font color and check "bold" item on.
- Add the new marker to the list.

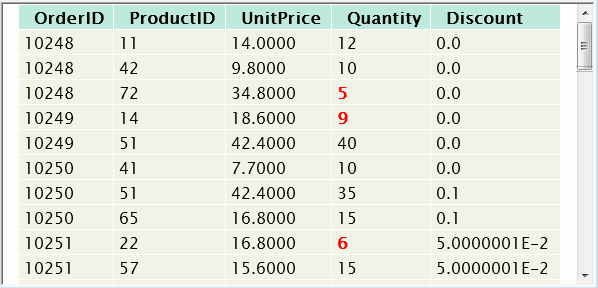
There is preview for generated report:

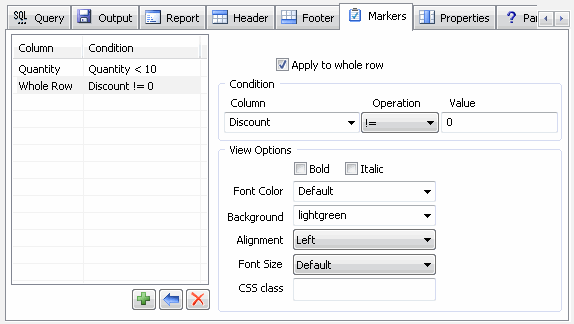
This example marks the whole row by green background if the discount more than 15%:
- Switch on "whole" row mode
- Select discount column for condition.
- Select >= as condition and use 0.15 (15%) for value.
- Use green color for background.

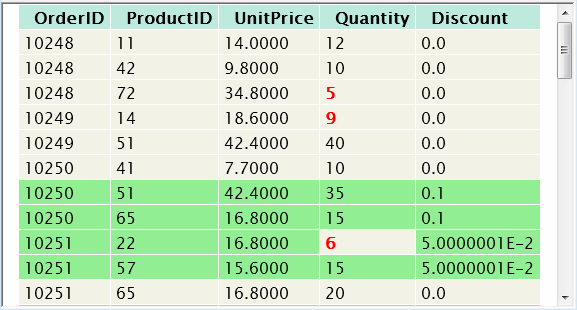
There is preview for generated report:

As you can see, the row marker has lower priority than the marker for an individual cell of the report table.
The next article will describe the converters feature. It helps the user to change a presentation of the value as well as markers and column properties change the design of the item.